Data Visualization

Data Visualization

Data Visualization

Data Visualization is the act of converting data to visual context. All managers and decision-makers are able to catch the facts behind the numbers in just a few seconds. Finding trends, patterns, outliers, and correlations in the visualized method have many benefits for data analyzers.

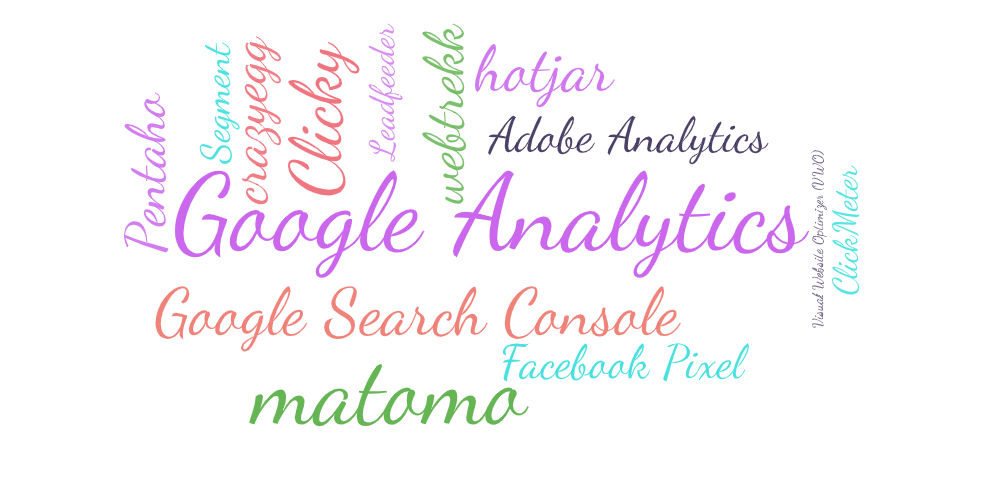
MOST FAMOUS VISUALIZATION PLUGINS

1

Most Famous Visualization Plugins

If you want to know your website visitors age, gender, location and their behavior and you are curious to make better decisions for the future to sell your products or to attract many more people to visit your website then the importance of web analytics will be one of the valuable studies for your business growth.

TYPES OF DATA VISUALIZATION CATEGORY

2

Types of Data Visualization Category

If you want to know your website visitors and their behavior and you are curious to make better decisions for the future to sell your products or to attract many more people to visit your website then the importance of web analytics will be one of the valuable studies on your website.

Bounce Rates

Bounce rate is a unique metric within Google Analytics and measures the percentage of the single page visit and it shows how a person leaves your website without visiting other pages than the landing page. We can help our clients to reduce the bounce rate with the help of some tips.

Exit Rates

On your website, Pageviews is a metric defined as the total number of individual time a page is loaded by a customer even when if a user clicks reload after reaching a page. Sessions represent a single visit to the website. A single Session can include many Pageviews.

Traffic Sources

Do you know where  your website traffic originated from? If you want to know exactly from which sources outside of search engines your visitors arrive on your website, the referral metric demonstrates you the tracks of clicks and shows you a variety of sources.

Conversion Rate

The conversion rate in web analytics means a completed online or offline activity after your visitors leave your website. It shows the final outcome of a website visit. Signing-up for a newsletter, a purchase, viewing a video, or clicking on an advertisement can be considered as completed actions.

Behavior Flow

On your website, Pageviews is a metric defined as the total number of individual time a page is loaded by a customer even when if a user clicks reload after reaching a page. Sessions represent a single visit to the website. A single Session can include many Pageviews.

Geography of Visitors

Location data can be useful for targeting your marketing and advertising. Google Analytics lets you know your visitor’s geographic location, such as continent, country, region, city, or even metro area. There are some tools that assist you to find all information about your visitors including their phone number and websites.

Device Usage

Knowing the percentage of people coming to your website via different sources such as smartphones, tablets, and other devices reveals some facts about your next investment policy on your hardware and software technologies. Google Analytics is a quick way to measure such important data.

Average Time on Page

Spending time on a single page indicates the quality and engagement of your different types of content and media. Google Analytics simply measures the average amount of time by calculating between first hit time and the last hit time.

Site Speed

Site speed is an important ranking factor and if a page on your website loads slowly, a user will leave the website quickly and the bounce rate of the website will decrease dramatically. It has a huge impact on search engine ranking as well.
IMPORTANCE OF WEB ANALYTICS

3

Best Web Analytic Tools